Italians Aren't Lactose Intolerant

December 19, 2016

In studies on lactose intolerance and its frequency in different populations, you'll often see numbers like 20-70% or 18-85% for Italy, with the highest percentages being in the south. The sources are usually old studies from the 80s or before, but there's a problem with the way testing was done back then. There are also the problems of incorrect self-diagnoses and confusion with different, less severe conditions like lactose maldigestion and irritable bowel syndrome.

According to Dr. Steve Hertzler of Iowa State University:

First, it is very important that people do not "self-diagnose". In addition, even when an individual goes to a physician for a diagnosis, the physician often uses an incorrect approach. The classic example of this is to put the patient on a lactose-free diet and see if the symptoms go away. The potential for "placebo" effect in this type of diagnosis is enormous. From double-blind studies our laboratory group conducted at the University of Minnesota, 1 out of 3 people who "self-diagnosed" themselves as severely lactose intolerant were actually able to digest 15 g lactose (just over 1 cup of milk). It is important to have objective evidence of lactose maldigestion. It is also important to realize that lactose maldigestion among varying individuals is more of a continuum than an "either-or" phenomenon. For example, traditional lactose tolerance tests done by physicians used 50 g of lactose in water after an overnight fast. This is equivalent to drinking a quart of milk on an empty stomach! This is not very physiological or realistic. Just because a person can not tolerate 50 g does not mean that he/she won't tolerate the 12 g in a cup of milk. In our double-blind studies, the symptom response to 12 g lactose was about 25% of subjects, which was not statistically different from a lactose-free placebo. Dose of lactose is a very important factor.

How should lactose intolerance be diagnosed? First, there is a difference between lactose maldigestion and lactose intolerance. The former term means that a person is unable to digest lactose to a certain degree. On average, lactose maldigesters malabsorbed about half of the lactose in 1 cup of milk (some more, some less). However, not everyone experiences symptoms from lactose maldigestion. I once did breath hydrogen testing on a dietitian who worked for the National Dairy Council. She turned out to be a lactose maldigester, but she had no symptoms from drinking milk. Lactose intolerance is when lactose maldigestion is coupled with gastrointestinal symptoms such as diarrhea, flatulence (most common), and stomach discomfort. A person who is experiencing GI symptoms that he/she suspects might be related to lactose maldigestion needs to have confirmation by an objective test. This is important to rule out other potential bowel conditions. Irritable bowel can often masquerade as lactose intolerance.

A later study on Sicilians (who are supposedly one of the most lactose intolerant groups in Europe) took all these facts into account and found a much lower frequency of the condition in a representative sample:

The present study is the first to attempt to clarify the dimensions of the problem of self-reported milk-intolerance, the real correspondence between self-reported milk-intolerance and gastrointestinal symptoms following the breath hydrogen test, and the impact of this self-diagnosis on dietary intake of total calories, proteins and calcium, using data from the general population and not from a pre-selected sample.

In a wide randomized sample representative of a rural community, we observed that 36% of the population were lactose-maldigesters, but only 4% of the whole study group (13% of the maldigesters) showed lactose intolerance after an oral load of 25 g lactose. Although many previous studies have reported a much higher frequency of gastrointestinal symptoms after lactose load in subjects with maldigestion, it has been underlined how field investigations indicate a greater average tolerance to milk than studies on patients referred to hospitals because of aspecific abdominal complaints.

[...]

After the cases of self-reported milk intolerants were selected, the analysis of the results is more interesting. The percentage of subjects who believe that they cannot tolerate milk and accordingly reduce milk consumption is considerable: 15% of the examined population. The results of the breath test after lactose challenge were, however, surprising: a) more than 1/3 of these subjects were actually lactose digesters and tolerants (normal H2 breath test and no symptoms following lactose load); b) only 10% of the self-reported lactose-intolerants were really intolerants and showed symptoms after a 25 g lactose load. These results, obtained in a non-selected group of healthy subjects representative of the general population, are in agreement with those recently reported by Suarez et al who showed that 9/30 self-reported lactose intolerants had a normal lactose digestion capacity and that in the remaining 21/30 the gastrointestinal symptoms did not worsen during administration of lactose-containing milk. It is therefore likely that in order to explain the gastrointestinal symptoms of many lactose-maldigesters, the possibility of a diagnosis of irritable bowel syndrome or of non-ulcer dyspepsia should be investigated. Our study also clarifies the impact of self-reported milk intolerance on dietary habits. These subjects did not consume milk, or consumed very low quantities of milk and their daily calcium intake was significantly lower. It must be underlined that in the population we studied daily calcium intake was generally much lower than the recommended level (500 mg vs. 800–1000 mg/day), and an unnecessary self-limitation of the consumption of a food rich in calcium, as milk is, seems to be a particularly serious risk factor for osteoporosis. In particular, recent prospective studies have suggested that reduced calcium intake during the adolescence and early adulthood may have a great impact on bone mineral density measurements; this result must induce physicians to pay particular attention to dietary calcium intake.

In conclusion, we affirm that in a representative sample of the general population, with an approximately 40% prevalence of lactase insufficiency, there was: a) a low frequency of lactose intolerance (4%); b) an incongruous overestimation of the frequency of milk intolerance: 15% of the general population; c) a low dietary calcium intake, which is even less satisfactory (300 mg/day) in subjects who limit milk consumption due to self-reported milk intolerance. Lactose digestion capacity should therefore be carefully investigated in all self-reported milk intolerant subjects.

Carroccio et al. "Lactose intolerance and self-reported milk intolerance: relationship with lactose maldigestion and nutrient intake". J Am Coll Nutr, 1998.

Height Gains in a Global Context

October 11, 2016

Even though Italians are seeing more height gains than Northern Europeans due to improved nutrition, they're still on the shorter side in a European context, but they're relatively tall compared to the rest of the world and moving steadily up the ladder.

According to a new study that analyzed measurements of people born between 1896 and 1996 in 200 countries, including large samples from all over Italy, a hundred years ago Italian men were the 57th tallest in the world (women 55th), but today they're the 29th tallest (women 32nd). The men grew by about 13cm (5in) from 165cm (5'5") to 178cm (5'10"), and the women by 11cm (4in) from 154cm (5'1") to 165cm (5'5").

Adult height for the 1896 and 1996 birth cohorts for men:


Adult height for the 1896 and 1996 birth cohorts for women:


Change in adult height between the 1896 and 1996 birth cohorts:


NCD Risk Factor Collaboration (NCD-RisC). "A century of trends in adult human height". eLife, 2016.

More Italian Population Structure

August 10, 2016

This new study is a follow-up to Di Gaetano et al. (2012) by the same team. It increases the number of SNPs, improves the sample selection criteria, and incorporates some newer methods, but it has a lot of the same problems. The main findings are that genetic variation in Italy is clinal going from the Western to the Eastern Mediterranean (with Sardinians as outliers) and that all Italians are made up of the same ancestral components, in different proportions, related to Paleolithic, Neolithic and Bronze Age settlements of Europe (with minor recent Lombard/Norman and Moorish admixture).

We hypothesize two simple historical scenarios leading to the observed genetic variability across Italy: (a) continuous ancient gene flow amplified by isolation-by-distance in recent times; (b) different ancestral origins of the main Italian macroareas whose distinguishability has been attenuated by genetic exchange in recent times.

Monmonier's algorithm revealed no evidence of the presence of genetic barriers across the peninsula. Instead, results from the Mantel test provide evidence of a correlation between genetics and geographical distance. The observed higher average length of the segments with shared IBD within regions compared with those shared between regions (Supplementary Table S2B) suggests recent isolation-by-distance across the wide range of latitude of the Italian peninsula. Moreover, a North to South gradient of increasing ancestral Ne was inferred for the three main macroareas (Northern, Central and Southern), coinciding with increased heterozygosity in Southern Italy. A similar trend was previously described for the rate of inbreeding and genome-wide similarity across Central Europe, and could be interpreted as a signature of the 'Out of Africa' migration during Palaeolithic expansions from refugia after the ice age and of ancient South-to-North migratory waves that occurred at the times of European colonization by Neolithic farmers. The ancestry and IBD analyses provided evidence of admixture in Italy with three major ancestries detected, most represented in Northern Europeans, Southern Europeans and Middle Eastern, respectively (with a small percentage of a North African component found in South Italy and Sardinia), with different prevalence across the peninsula. None of these components is fixed in any population, meaning that there is a poor fit with a strict admixture model, as assumed by the algorithm used, and supporting a process of continuous gene flow in multiple directions (migratory waves to and from Italy). According to previous studies on the Y chromosome and mtDNA, the Middle Eastern ancestry in Southern Italians most likely originated at the time of the Greek colonization and, with a smaller percentage, of the subsequent Arabic domination, whereas in Central-Northern Italy it is possibly because of the admixture of the indigenous residents with Middle Eastern populations spreading from the Caucasus to Central Europe. Our results agree with previously published reports describing a possible maritime route of colonization across Europe, including Italy, although we cannot exclude the occurrence of more recent demographic events leading to a similar scenario. Finally, the homogenous ancestral effective population size across Italian regions could be interpreted as reflecting common genetic origins, taking also into account previous considerations, although the same results might also occur in comparing populations without common origins.

Our study supports the notion that genetic variability across Italy is likely to represent continuous gene flow leading to differences in the proportion of ancestry from different sources, along with genetic exchange among neighbouring populations (eg, Northern Italian with European countries, Southern Italian with Middle Eastern and North African ones). Previous studies, analysing uniparental markers, found Y-chromosome genetic discontinuity across Italy. This contrasts with a general lack of structure for mitochondrial DNA, and with a higher homogeneity for maternal than paternal genetic contributions, suggesting different demographic and historical dynamics for females and males in Italy.

One issue is that the samples are still unevenly distributed, with a big gap between North-Center and South — which is reflected in the PCAs — and almost nothing from the eastern part of the country. (Note: the genetic gap between Aosta Valley and its very close neighbor regions is due to some of it being ethnically French).


Principal component analysis based on the coancestry matrix including Sardinians (b) and excluding Sardinians (c); x and y axes were inverted to emphasize similarity to the geographical map of Italy.

This time they do include a few Iberians for comparison, and that's who Northern Italians cluster with. But besides a few Cypriots, there are still no Greeks, which Paschou et al. (2014) and many other studies show Southern Italians clustering with. Sardinians, as always, are the closest to Ötzi the Iceman.


Fiorito et al. "The Italian genome reflects the history of Europe and the Mediterranean basin". Eur J Hum Genet, 2016.

Related: Much Better Population Structure

WW2 Internment Was No Big Deal

July 8, 2016

Some people like to make a big deal out of the internment of Italian American "enemy aliens" during World War 2 and claim that it's been unfairly ignored by history (German American internment gets ignored too, but whatever). The reality though, is that it was simply nothing worth mentioning compared to what the Japanese suffered, because Italians benefited from white privilege.

The contrast between treatment of the Italian Americans and the Japanese, the other non-Nordic group subject to being linked by ancestry to the fascist war effort, was stark. As 120,000 Japanese Americans — 40,000 of them classed as enemy aliens — went to detention camps, Italian American aliens suffered only relatively brief harassment, especially directed against Pacific Coast fisherman and waterfront residents. With a congressional committee holding that evacuation policies for Italian Americans were "out of the question if we intend to win this war," Roosevelt urged caution. In May 1942, almost two-thirds of all enemy aliens were Italian Americans but less than one-seventh of enemy aliens in federal custody were. The following month New York City's Italian American mayor, Fiorello LaGuardia, led the New York at War procession, which banned Japanese Americans. In the context of the 1942 election, Roosevelt rescinded the enemy alien designation against Italian Americans and expedited naturalization processes for them. Japanese aliens, who unlike Italians had never had the opportunity to naturalize, stayed in custody. Earl Warren, a supporter of Japanese internment who later served as chief justice of the U.S. Supreme Court, explained that Italians were "just like everybody else" and therefore should not be held. A remarkable article published by the NAACP found the Japanese to be victims of "barbarous treatment [as a] result of the color line" and Italians able to escape such treatment because they were "white."

Even the most notorious racist in U.S. politics, Mississippi senator Theodore Bilbo, seemed to reluctantly agree that Italian Americans could not be racially attacked. Bilbo had responded to an Italian American supporter of fair employment practices by addressing her as "My Dear Dago." When [Congressman Vito] Marcantonio rebuked him, the Mississippian additionally called his adversary a "political mongrel." However, as the controversy garnered press attention, Bilbo reigned in his tendency to demean "racial" and "ethnic" minorities in the same screeds. He assured all that he acted out of "the respect and love I have for the Caucasian blood that flows not only in my veins but in the veins of Jews, Italians, Poles and other nationalities of the White race [whom] I would not want to see contaminated with Negro blood."

David R. Roediger. Working Toward Whiteness: How America's Immigrants Became White: The Strange Journey from Ellis Island to the Suburbs. New York: Basic Books, 2006.

Biochemistry of Skeletons from Ancient Rome

February 26, 2016

A new scientific study, and an older one it references, confirm that there were very few foreigners in Ancient Rome by chemically analyzing skeletons from three non-elite imperial-era cemeteries. The data show that non-locals were in the minority, and most came from other parts of Italy or nearby provinces in Southern/Central Europe. Only 1 individual definitely came from outside of Europe (North Africa), and another 2 possibly did, but results are inconclusive. Note that non-European "Romans" have been discovered as far away as the British Isles.


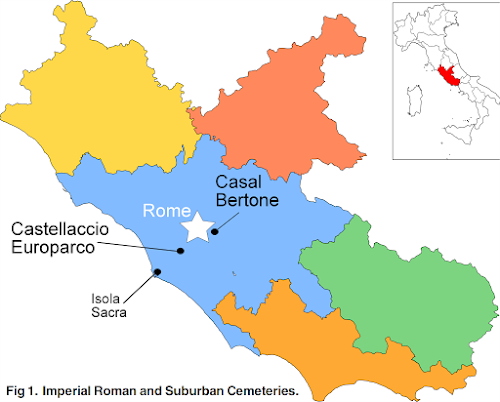
In order to assess migration to Rome within an updated contextual framework, strontium isotope analysis was performed on 105 individuals from two cemeteries associated with Imperial Rome—Casal Bertone and Castellaccio Europarco—and oxygen and carbon isotope analyses were performed on a subset of 55 individuals. Statistical analysis and comparisons with expected local ranges found several outliers who likely immigrated to Rome from elsewhere.

[...]

Who immigrated to Rome?


Of the nonlocal sample (n = 4), there are three adult males and one adolescent of unknown sex. Two of the males fall in the Middle Adult category (35-50) and one into the Older Adult category (50+), while the Adolescent is between 11-15 years old. The other four individuals whose isotope ratios were different from local Roman expectations, although not statistically conclusive, include two Older Children (7-12 years old), one probably male older Adolescent (11-15 years old), and one older Adolescent female (16-20 years old).

[...]

It is also impossible to answer from the present data whether these individuals were voluntary or compulsory migrants. The status of slave was multifaceted and mutable during the Empire [130], and there is no indication in the archaeological information from Casal Bertone and Castellaccio Europarco that any specific individual was a slave. There is, however, no evidence from isotopes that individuals buried in the mausoleum at Casal Bertone were nonlocal, whereas the necropoleis at Casal Bertone and Castellaccio Europarco both produced skeletons with nonlocal isotope ratios. Burial in a necropolis was customary for the lower classes, while burial in a mausoleum cost more [77]. These isotope data may be showing a form of economic, status-related migration, with more lower class individuals and possibly slaves moving to Rome compared to wealthier individuals. Additional testing would be needed, though, to confirm this hypothesis.

[...]

Where did immigrants come from?


Because migrants often came to Rome in diasporic waves resulting from slavery, attempting to identify a general geographic origin can be instructive. The combination of strontium and oxygen isotope analyses is particularly useful for this in western Europe, although only general predictions of homeland can be made. Oxygen isotopes on the continent vary roughly east-to-west, while strontium isotopes are higher in the older rock of mountains such as the Alps and lower in the younger rock of volcanic areas like most of peninsular Italy. From the perspective of Rome, oxygen isotope ratios will decrease as one moves into the Apennine range running along the spine of Italy, and strontium isotope ratios will increase to the north and decrease to the south.

The four individuals with clearly anomalous isotope ratios—T15, ET38, T24, and T36—fall into three distinct strontium and oxygen isotope combinations. T15 and ET38 have oxygen isotope ratios within range of Rome, but strontium isotope ratios that are significantly higher, suggesting a possible origin in a place with older geology, such as the Alps or one of the islands in the Tyrrhenian Sea. As people arrived at Rome from all over the Empire, however, there are numerous locations in which these individuals could have been born.

Individual T24 has low strontium and low oxygen isotope ratios compared to Rome, suggesting an origin somewhere with a cool, wet climate and basalt or limestone substrate, such as the Apennines. Individual T36 has high oxygen and low strontium isotope ratios, suggesting an origin in a region of limestone or basalt with a hotter, drier climate than Rome, such as North Africa. For these individuals, however, a dietary explanation for the anomalous strontium isotope ratios, while much less likely owing to the concomitant δ18O values, cannot be completely ruled out. As Rome imported significant amounts of grain from north Africa during the Empire, and as human strontium isotope ratios from Egypt and the Nile Valley have been shown to be lower than those in Rome (around 0.707 to 0.708) [131], it is not impossible that T24 and T36 were consuming a significant amount of imported grain as children. Still, as shown further below, the dietary explanation is less likely than is an origin elsewhere.

The four additional individuals whose isotopes may indicate they were immigrants—T8, T70, T39, and ET76—fall into the categories above. T8 and ET76 have higher-than-expected strontium isotope ratios, showing up as outliers in the box plot in Fig 3. They may have arrived at Rome from a region of older geology such as northern Italy. Individuals T70 and T39, while not statistical outliers in the oxygen isotope box plot in Fig 5, are nevertheless 0.6-0.7‰ higher than the next closest local, suggesting they may also be immigrants. They could have arrived at Rome from a drier climate like North Africa. These four individuals highlight the challenge of identifying immigrants to Rome from a vast geographical expanse.

Finally, the fact that there is a large spread in both the strontium and oxygen isotope data compared to results obtained from other archaeological populations could indicate that people were arriving at Rome from places not too far removed, in a form of centripetal migration, as Prowse and colleagues [76] suggest for Portus. Both the strontium and the oxygen isotope ratios from Rome are diverse, and it is not unreasonable to assume that these may reflect the diversity of the population as well. It is also possible that even more individuals are essentially isotopically invisible migrants, if they came to Rome from homelands with similar strontium and/or oxygen isotope values. Further isotopic and DNA work will be necessary to better understand origins and homelands from skeletal remains.

Killgrove and Montgomery. "All Roads Lead to Rome: Exploring Human Migration to the Eternal City through Biochemistry of Skeletons from Two Imperial-Era Cemeteries (1st-3rd c AD)". PLOS One, 2016.

Oxygen stable isotope ratios (δ18O) have been determined in carbonate in paired first and third molar teeth from individuals (N = 61) who lived in the town of Portus Romae ("Portus") and who were buried in the necropolis of Isola Sacra (First to Third centuries AD) near Rome, Italy. We compare these analyses with data for deciduous teeth of modern Roman children. Approximately one-third of the archaeological sample has first molar (M1) values outside the modern range, implying a large rate of population turnover at that time, consistent with historical data. Delta 18Oap values suggest that a group within the sample migrated to the area before the third molar (M3) crown had completely formed (i.e., between 10 and 17.5 years of age). This is the first quantitative assessment of population mobility in Classical antiquity. This study demonstrates that migration was not limited to predominantly single adult males, as suggested by historical sources, but rather a complex phenomenon involving families. We hypothesize that migrants most likely came from higher elevations to the East and North of Rome. One individual with a higher δ18O value may have come (as a child) from an area isotopically similar to North Africa.

[...]

Origins of the immigrants to Imperial Rome


There are several possible origins for the outsiders (at birth) buried in the cemetery of Isola Sacra who must have come from regions where δ18O of local precipitation is lower than in Rome by up to 2.6%. One possible region of origin is the Roman Imperial provinces lying to the North of the Italian landmass. In general, the δ18O of modern precipitation decreases northward, reaching values up to 3% less than found in Rome (Bowen and Wilkinson, 2002; Longinelli and Selmo, 2003), within the geographic range of the Roman Empire of 100 CE. Isotope ratios of average annual precipitation to the North of Italy would generally be lower than the values required to account for the outsiders’ values. Furthermore, seasonal variation in δ18O of precipitation in these more northern regions is larger than in Rome because the range between winter and summer temperature increases as average annual temperature decreases, and because δ18O varies linearly with temperature. Thus, an individual whose M1 teeth happened to mineralize through the winter months while consuming water largely derived from precipitation would display significantly lower δ18Oap values than "local" Romans.

As another possible locus for the outsiders, we note that δ18O values of modern meteoric water vary continuously to values up to 4% lower than those encountered in Rome at distances as close as 100 km in the foothills and heights of the Apennine Mountains (Longinelli and Selmo, 2003). Derivation of the outsiders principally from this region seems to be the most likely scenario. Other possible regions of origin of the outsiders might be the Iberian Peninsula or Greece, both of which were under Roman control at this time. Rain falling in these regions also displays δ18O values lower than those corresponding to the outsiders’ inferred drinking water, although coastal regions in both these provinces might have included such values.

The continuous gradation of δ18Oap between local and outsider δ18Oap values suggests that these individuals came from locations at gradually farther distances and gradually higher elevations than Rome. If the outsiders were from as far away as southern Gaul (where δ18O of rain is about 2% lighter than in Rome), we would expect to see a cluster of analyses at discretely lower δ18Oap values, rather than the continuum that we actually observe. However, we can not exclude the possibility that some of the outsiders came from further away to the north.

[...]

Conclusions


The δ18Oap values show that approximately one-third of the individuals in our sample were not born in the region around Rome, but migrated to this area from regions where local drinking water has somewhat lower δ18Oap values. It has further been shown that a significant minority of the sample as a whole were individuals who migrated as children, so that migration to Portus was not a predominantly single adult male activity. Migrants to Portus were families, most obviously as children accompanying the parents.

The data support historical demographic estimates of high mortality rates in the Roman urban region, and the consequent need for high rates of population replacement to maintain the size of the Roman population in this era. Although such isotopic data suggest a method of quantitative assessment of this steady population replacement, a detailed numerical estimate is beyond the scope of this paper. The individuals with low δ18Oap values could have been from as close as 100 km to Rome, in the hills surrounding the Apennine Mountains. It is also possible that they came from the transalpine provinces of the Roman Empire much further to the north, where low δ18Oap precipitation falls even at low elevations. However, due to the observed scatter of the δ18Oap data around the "local" Roman range, we conclude that this latter explanation seems less likely. Only one individual was found to have a conspicuously high δ18Oap value; the observed value is consistent with an origin in a region with higher δ18Oap in drinking water, like the Nile Delta, although it is impossible to exclude possible origins in southern Italy. Further Sr isotopic analyses of these teeth might help to resolve this issue. Analyses of δ18Oap in bones of these same people may also show further evidence of population movement during adulthood.

Prowse et al. "Isotopic Evidence for Age-Related Immigration to Imperial Rome". Am J Phys Anthropol, 2007.